Outcome: Try-On Data
A leading signal sales data cannot give you.
Sales data tells you what happened. Try-on data can reveal what shoppers considered, tried, and rejected before checkout. Uwear captures those signals as part of the visual production workflow.

Industry context
Fitting room intelligence, brought online.
Physical retail has always known what enters the fitting room versus what leaves the register. E-commerce has not. Virtual try-on captures that intermediate signal so teams can act on intent before it shows up in sales.
- Shoppers who leave without buying
- 97%+
- Try-on as active signal
- Strongest
- Fitting room intelligence precedent
- Decades
Typical share of e-commerce visitors who do not convert, leaving demand signals hidden in browsing and cart behavior.
Try-on is a deliberate action, qualitatively stronger than passive page views, time on page, or wishlist adds.
Retailers such as Zara have used fitting room tracking to shorten design and replenishment cycles for years.
Benchmarks are shared as category context for why try-on signals matter. Uwear data availability depends on catalog integration, shopper consent, and the try-on experience shipped.
Mechanism
A try-on event is a structured intent signal.
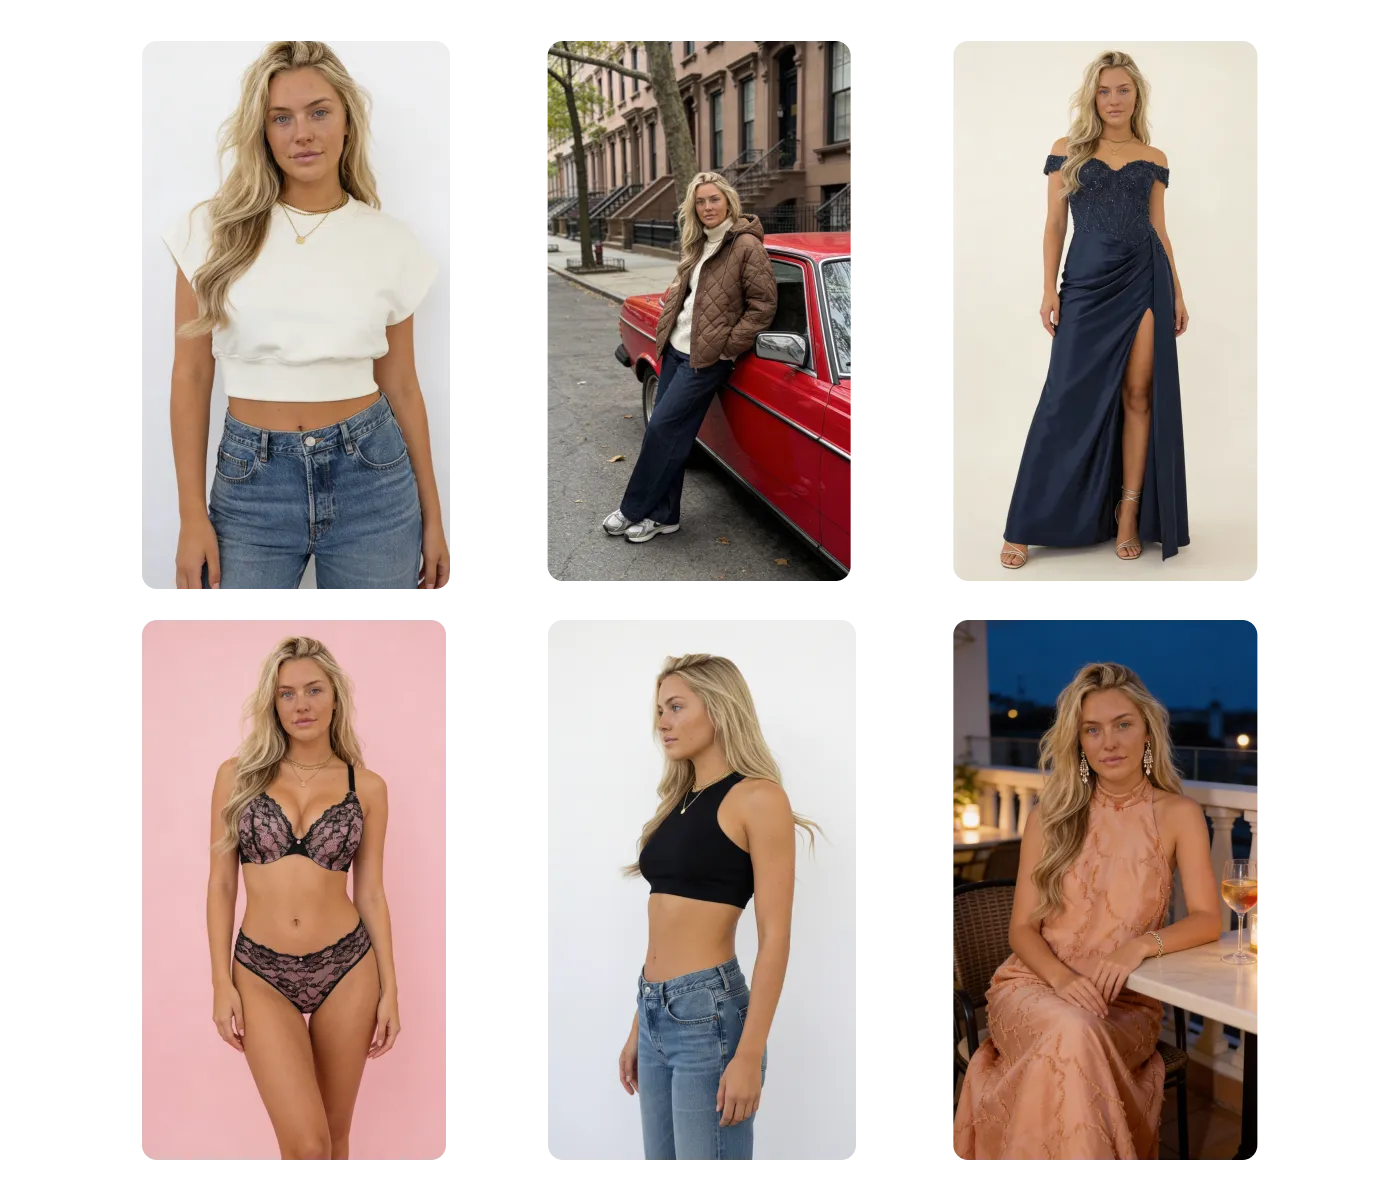
When a shopper tries on a garment through Uwear, the engine records the product, size, styling combination, and outcome alongside the generated visual. That signal is captured consistently across the catalog and made available to merchandising, planning, and product teams.
- Capture try-on events with product, size, styling, and outcome context attached.
- Keep art direction consistent so signals are comparable across products, categories, and seasons.
- Feed signals into existing data stacks through API, webhooks, and metadata handoff.
- Respect shopper consent and privacy by surfacing only aggregated, anonymized insight to brand teams.
Use cases
Where try-on data changes decisions.
Try-on data is one output of the same visual production engine. Teams can combine it with catalog coverage, outfit generation, and QA to close the loop between intent and action.
- 01Read about try-on
Virtual try-on signal capture
Turn each try-on event into a leading signal of demand, sizing intent, and styling interest for merchandising.
- 02See catalog visuals
Catalog coverage for the long tail
Generate on-model visuals for products without a shoot so try-on signals extend across the full catalog.
- 03Explore agent mode
Outfit and styling intelligence
See which combinations shoppers actually try together, then feed that into merchandising and recommendations.
- 04Read the batch feature
QA and approvals before publish
Review and approve generated visuals so try-on signals come from accurate, on-brand imagery only.


Operating playbook
How data teams can use this.
A practical sequence for turning try-on events into a leading signal that merchandising and planning can act on.
- 01
Define the signal you need
Decide whether the priority is demand, sizing intent, styling interest, or conversion diagnosis, and map the events that support it.
- 02
Lock consistent art direction
Generate visuals from one art direction so try-on signals stay comparable across products, categories, and seasons.
- 03
Capture and route signals
Send try-on events through API or webhooks into the existing data stack, with metadata and provenance attached.
- 04
Act and close the loop
Use signals to adjust pricing, inventory, and merchandising, then measure whether try-on intent converts into sales.
Next step
Map your first try-on data workflow.
Start with a demo. Then decide between studio, API, agents, or a custom path that fits your data and merchandising team.